Performance analysis is one of the key task for every system admins which is an important point for the the system availability ( especially production systems with SLA basis).We should do the periodical check for the various system parameters and ensure nothing is getting in to wrong way which is hampering the normal operations of the production systems .
The main factores we should consider for system performance analysis are disk IO, CPU,Memory & Swap,network and zones ( i am omitting other service components like name services , NFS, kernel tuning etc.. which can be discussed separately).
Load average can be monitored by the command uptime or monitoring the run queue time of the processors using sar -q command
uptime
*******
bash-3.2# uptime
4:29pm up 34 day(s), 14:45, 2 users, load average: 0.45, 0.49, 0.54
The last 3 numbers are the load average which will be 1,5,15 minutes interval. Now we need to find what is load metric . This metric for a particular load at given point of time is how many processes are queued per the running process ( including the current running ones). For example in last minute if the load average is 0.50 means half of the time of the last minute CPU was idle with out any running processes. Another example of the load average is 2.50 in last minute means average of 1.5 processes are waiting to run in the queue and the CPU was overloaded by 150%
The load average can be monitored by analyzing the run queue length and amount of time to take for that using the sar -q command .
Using the sar-q command we will getto know the following information
1. The average queue length while the queue is occupied
2. The percentage of time that the queue is occupied.
If you check the command output header you will get below details from sar -q
SunOS testsolaris 5.10 Generic_144488-05 sun4v 12/15/2015
00:00:00 runq-sz %runocc swpq-sz %swpocc
01:00:01 1.0 1 0.0 0
02:00:00 1.0 1 0.0 0
03:00:01 1.0 1 0.0 0
04:00:00 1.0 1 0.0 0
05:00:00 1.1 1 0.0 0
06:00:00 1.0 1 0.0 0
07:00:00 1.0 1 0.0 0
08:00:01 1.1 5 0.0 0
............................................
Average 1.0 3 0.0 0
run-sz - This indicates the number of kernel threads in the memory which is waiting to occupy the CPU. Normal value of this should be less than 2 and if it is consistently become high the system CPU is fully utilized ( can consider about adding more CPU)
%runocc - This indicates the run queue (dispatch) occupancy . The consistent run queue occupancy is the CPU saturation .
swap-sz - The average number of swapped out processes
%swapocc- The percentage of time in which the processes are swapped out.
So by over all if the %runocc is greater than 90 and runq-sz value is greater than 2 we should consider about adding more CPU for a consistent system performance.
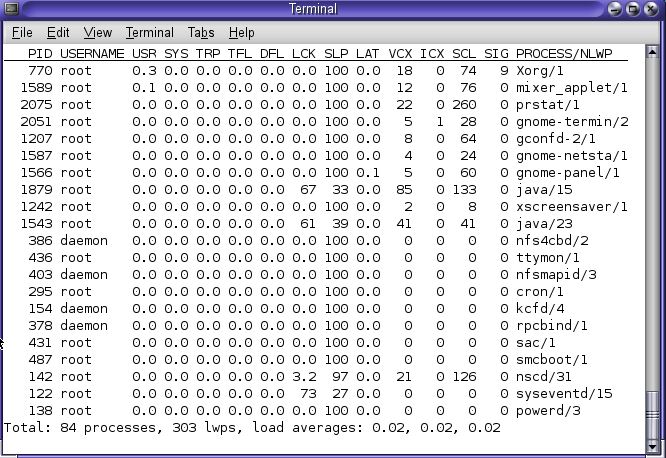
Prstate
***********
This is one of the most widely utilized system utility for below cases
1. How much my system utilized in case of CPU & memory
2. Utilization of the system ( zone wise,user wise,process wise )
3. How are the processes/threads utilizing the system ( user bond, I/O bond)

PID: the process ID of the process.
USERNAME: the real user (login) name or real user ID.
SIZE: the total virtual memory size of the process, including all mapped files and devices, in kilobytes (K), megabytes (M), or gigabytes (G).
RSS: the resident set size of the process (RSS), in kilobytes (K), megabytes (M), or gigabytes (G).
STATE: the state of the process (cpuN/sleep/wait/run/zombie/stop).
PRI: the priority of the process. Larger numbers mean higher priority.
NICE: nice value used in priority computation. Only processes in certain scheduling classes have a nice value.
TIME: the cumulative execution time for the process.
CPU: The percentage of recent CPU time used by the process. If executing in a non-global zone and the pools facility is active, the percentage will be that of the processors in the processor set in use by the pool to which the zone is bound.
PROCESS: the name of the process (name of executed file).
NLWP: the number of lwps in the process.

Also one more option in prstat which is called microstat accounting (prstat -m) and it will provide the CPU latency , system time, etc

In nutshell we can assume CPU performance issues as below
1. The number of processes in run queue is greater than the number of CPU's in the system
2. If the process queue is 4 times more than the number of available CPU's in the system
3. Also if the CPU idle time is 0 and system time is double than the user time , then the system is facing some major CPU shrink.
Also we have 3rd party performance analysis tools like Dtrace which will be discussed separately in other occasion .
The main factores we should consider for system performance analysis are disk IO, CPU,Memory & Swap,network and zones ( i am omitting other service components like name services , NFS, kernel tuning etc.. which can be discussed separately).
CPU Loading
Load average is the average over time the number of processes in run queue. This is used to represent the load on CPU and load average refers to three numbers with 1-5-15 minutes intervals . Typically the load average divided by the number of cpu cores are used to find the load per cpu and the load average above 1 per cpu is considered as cpu is fully utilized . Also a general rule of thumb in load average is "average value which is 4 times the number of cpu results a sluggish performance".
Load average can be monitored by the command uptime or monitoring the run queue time of the processors using sar -q command
uptime
*******
bash-3.2# uptime
4:29pm up 34 day(s), 14:45, 2 users, load average: 0.45, 0.49, 0.54
The last 3 numbers are the load average which will be 1,5,15 minutes interval. Now we need to find what is load metric . This metric for a particular load at given point of time is how many processes are queued per the running process ( including the current running ones). For example in last minute if the load average is 0.50 means half of the time of the last minute CPU was idle with out any running processes. Another example of the load average is 2.50 in last minute means average of 1.5 processes are waiting to run in the queue and the CPU was overloaded by 150%
The load average can be monitored by analyzing the run queue length and amount of time to take for that using the sar -q command .
Using the sar-q command we will getto know the following information
1. The average queue length while the queue is occupied
2. The percentage of time that the queue is occupied.
If you check the command output header you will get below details from sar -q
SunOS testsolaris 5.10 Generic_144488-05 sun4v 12/15/2015
00:00:00 runq-sz %runocc swpq-sz %swpocc
01:00:01 1.0 1 0.0 0
02:00:00 1.0 1 0.0 0
03:00:01 1.0 1 0.0 0
04:00:00 1.0 1 0.0 0
05:00:00 1.1 1 0.0 0
06:00:00 1.0 1 0.0 0
07:00:00 1.0 1 0.0 0
08:00:01 1.1 5 0.0 0
............................................
Average 1.0 3 0.0 0
run-sz - This indicates the number of kernel threads in the memory which is waiting to occupy the CPU. Normal value of this should be less than 2 and if it is consistently become high the system CPU is fully utilized ( can consider about adding more CPU)
%runocc - This indicates the run queue (dispatch) occupancy . The consistent run queue occupancy is the CPU saturation .
swap-sz - The average number of swapped out processes
%swapocc- The percentage of time in which the processes are swapped out.
So by over all if the %runocc is greater than 90 and runq-sz value is greater than 2 we should consider about adding more CPU for a consistent system performance.
Prstate
***********
This is one of the most widely utilized system utility for below cases
1. How much my system utilized in case of CPU & memory
2. Utilization of the system ( zone wise,user wise,process wise )
3. How are the processes/threads utilizing the system ( user bond, I/O bond)

USERNAME: the real user (login) name or real user ID.
SIZE: the total virtual memory size of the process, including all mapped files and devices, in kilobytes (K), megabytes (M), or gigabytes (G).
RSS: the resident set size of the process (RSS), in kilobytes (K), megabytes (M), or gigabytes (G).
STATE: the state of the process (cpuN/sleep/wait/run/zombie/stop).
PRI: the priority of the process. Larger numbers mean higher priority.
NICE: nice value used in priority computation. Only processes in certain scheduling classes have a nice value.
TIME: the cumulative execution time for the process.
CPU: The percentage of recent CPU time used by the process. If executing in a non-global zone and the pools facility is active, the percentage will be that of the processors in the processor set in use by the pool to which the zone is bound.
PROCESS: the name of the process (name of executed file).
NLWP: the number of lwps in the process.
Also you can sort the prstat by ascending ( S option) or descending (s option) with respect to below parameters
cpu - sort by cpu usage ( by default this option is applicable)
pri - By process priority
rss- Set by resident set size
size- By size of the process image
time- Sort by execution time
If you want the utilization report according to zone wise use prstat -Z . Here you can see global zone and testzone separately

Also one more option in prstat which is called microstat accounting (prstat -m) and it will provide the CPU latency , system time, etc
In nutshell we can assume CPU performance issues as below
1. The number of processes in run queue is greater than the number of CPU's in the system
2. If the process queue is 4 times more than the number of available CPU's in the system
3. Also if the CPU idle time is 0 and system time is double than the user time , then the system is facing some major CPU shrink.
Also we have 3rd party performance analysis tools like Dtrace which will be discussed separately in other occasion .
No comments:
Post a Comment